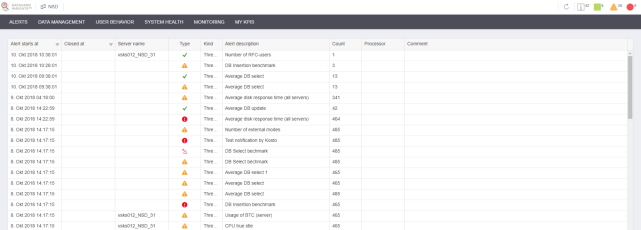
Alert List
An alert is created when the value of a KPI exceeds a threshold or when the KPI behaves in an unusual way, i.e. an anomaly type of alert. The Alerts tab displays alerts that are active on the current day – starting after midnight. For more information about how to set up an alert, see the section Set / Update Threshold.
You can view alerts in all systems or in specific systems:
-
To view alerts in all systems, go to the Alerts tab in the main view.
-
To view alerts in a specific system, select any system in the main view. The Alerts tab is displayed first in the system detail view by default.
An alerts table contains the following columns:
-
Alert starts at: Specifies the start time of the alert
-
Closed at: Specifies the end time of the alert
-
Server name: Specifies the name of the server
-
Type: Specifies the type of alert: Possible values: Error; Warning; Success
-
Kind: Specifies the kind of alert: Possible values: Threshold; Anomaly
-
Alert description: Specifies the description of the alert
-
Count: Displays the number of alert occurrences
-
Processor: Specifies who is responsible for resolving notifications
-
Comment: Provides information about the alert, for example if IT support is already working on the alert
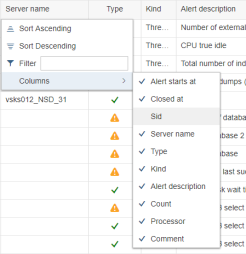
You can change the order of columns via drag and drop, arrange the order of data, or filter data via the table menu. The table menu is displayed when you click the table header.
You can define a filter in the table menu to adjust which columns are visible.
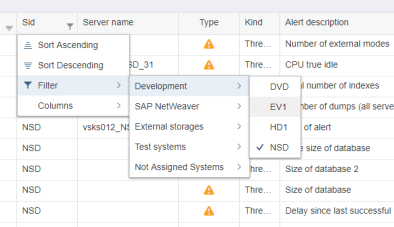
You can also add alerts from different systems. To do so, click the header of the SID column. Then select Filter and add or remove systems from the filter.
Displaying and Editing Alerts
After you click a specific alert in a row, the details of the selected alert are displayed.
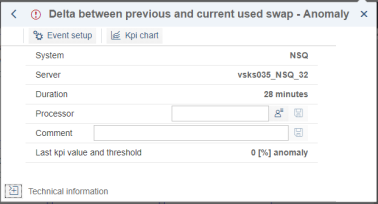
You can directly edit and save the fields Processor and Comment.
You can click  to fill your login details in the Processor field.
You can click Technical information to view the technical details of an alert.
The action buttons Event setup and KPI chart are also displayed at the top of the window.
Event Setup
The Event setup option allows you to set up, change or delete the alert. You can specify either a threshold or an anomaly alert. For a threshold alert, you can specify the minimum or maximum limit for the selected KPI.
The following options are available:
-
Description: Specifies the description of the alert
-
Raise: Specifies the type of alert. Possible values: Success; Warning; Error; Issue
-
Alert when: Allows you to specify a condition and define the time in milliseconds when the alert is raised:
-
KPI is equal to
-
KPI is not equal to
-
KPI is greater than
-
KPI is lower than
-
KPI is greater than or equal to
-
KPI is lower than or equal to
-
Advanced Options
The following advanced options are available:
-
Evaluate alert each: Specifies how often the user receives an alert message due to the raised alert.
-
Raise alert after: Specifies the threshold condition. The alert is raised if the threshold condition is valid for the specified time.
-
Close alert after: Specifies the threshold. The alert is closed if the KPI does not reach the threshold for the specified time.
Setting Notifications
In the notification settings, you can define how often you want to receive a notification.
KPI Chart
The KPI chart option navigates you to a line chart containing the KPI values of the alert. For more information, see the chapter System Monitoring.
